Two years ago I made Dichotomy, a Cubist series that broke a face apart to show a mind divided between mania and depression. Mixed States is its continuation. It keeps the same rule-based, chance-driven method, but it leaves the face behind and moves from the screen onto paper, drawn line by line by a pen plotter.
Dichotomy is a conceptual, cubist series that explores the fractured identity of the disorder. Positioned between mania and depression, it invites viewers to look through the lens of a mind at war with itself.
The intent of this piece is to externalize the inner duality of bipolar disorder through a Cubist deconstruction of the face, using rule‑based procedures and chance. The piece’s thesis is that identity is an algorithmic concept that is continuously recombined by perception, memory, and mood states.
This series draws deep inspiration from Picasso’s Cubism, particularly his ability to fragment the human form to reveal multiple perspectives at once. Just as Picasso broke away from traditional representation to expose the hidden dimensions of reality, Dichotomy fractures the face to externalize the inner conflict of bipolar disorder. His radical deconstruction of identity became a framework for us to translate psychological dualities into visual form, where the chaotic overlap of lines and shapes mirrors the volatility of the mind.
Coming back to the series, I wanted to test the claim at its center: that identity is algorithmic and constantly recombined by mood. Dichotomy showed that recombination in a portrait. This new work asks what happens to the drawing when the two states stop taking turns and begin to happen at the same time, which is a real state that a person with bipolar disorder, called a Mixed State.
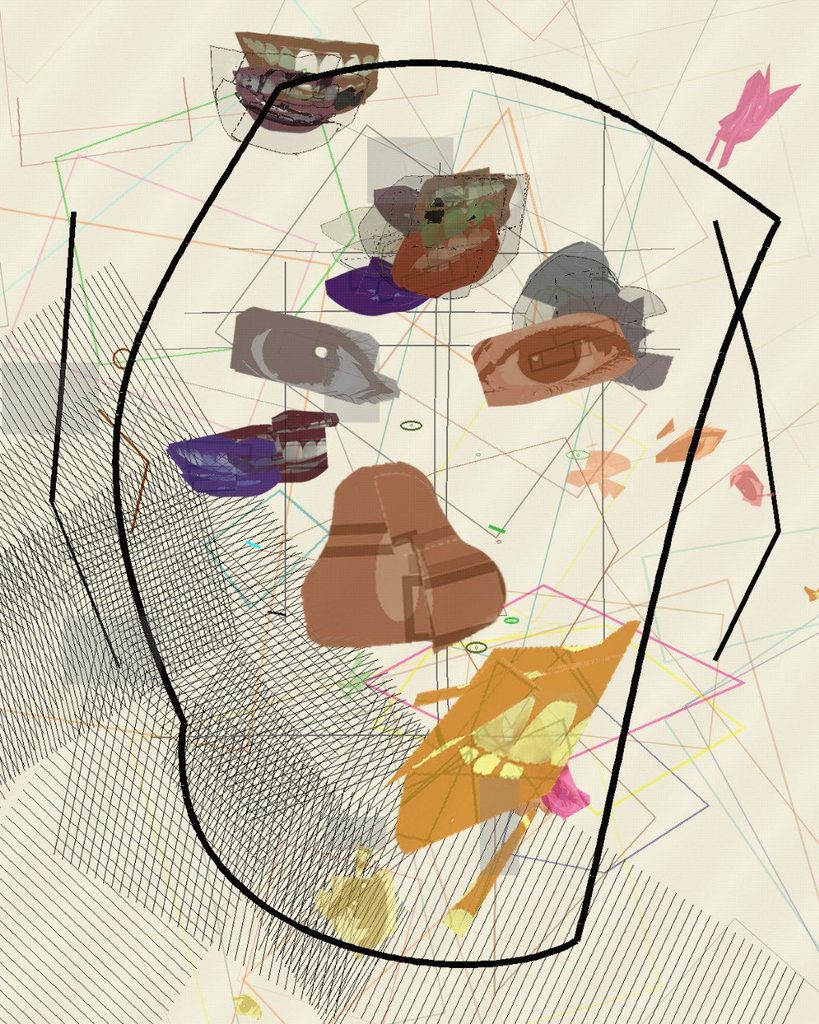
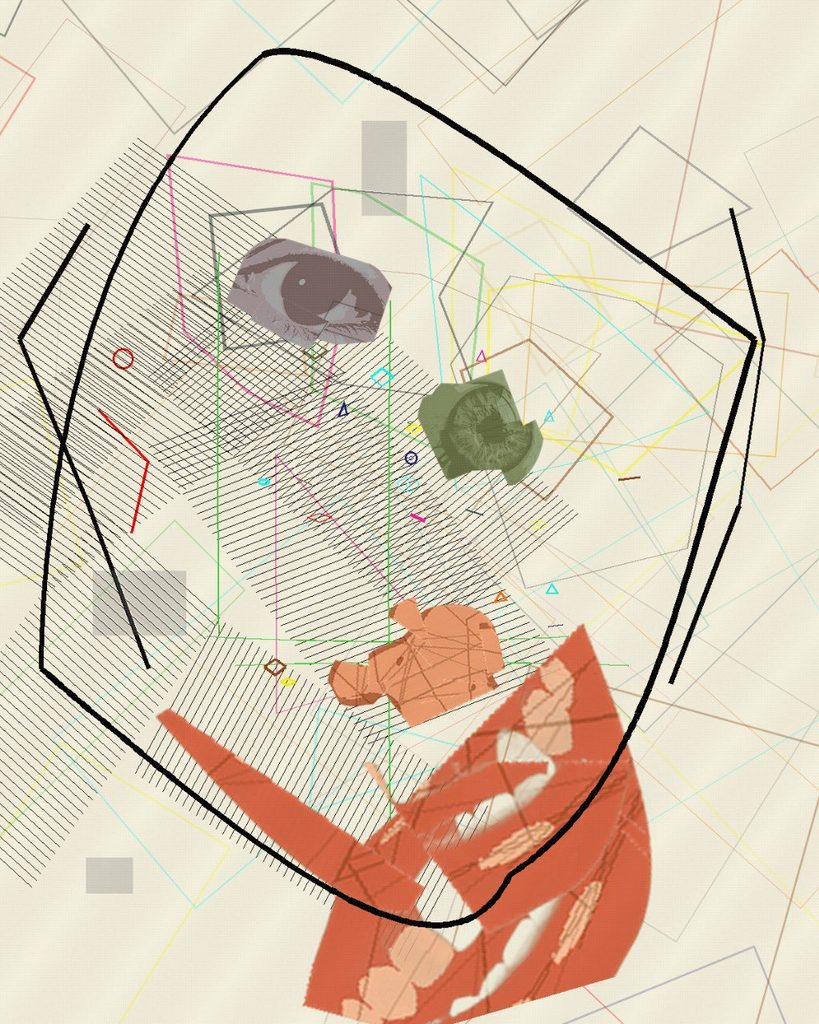
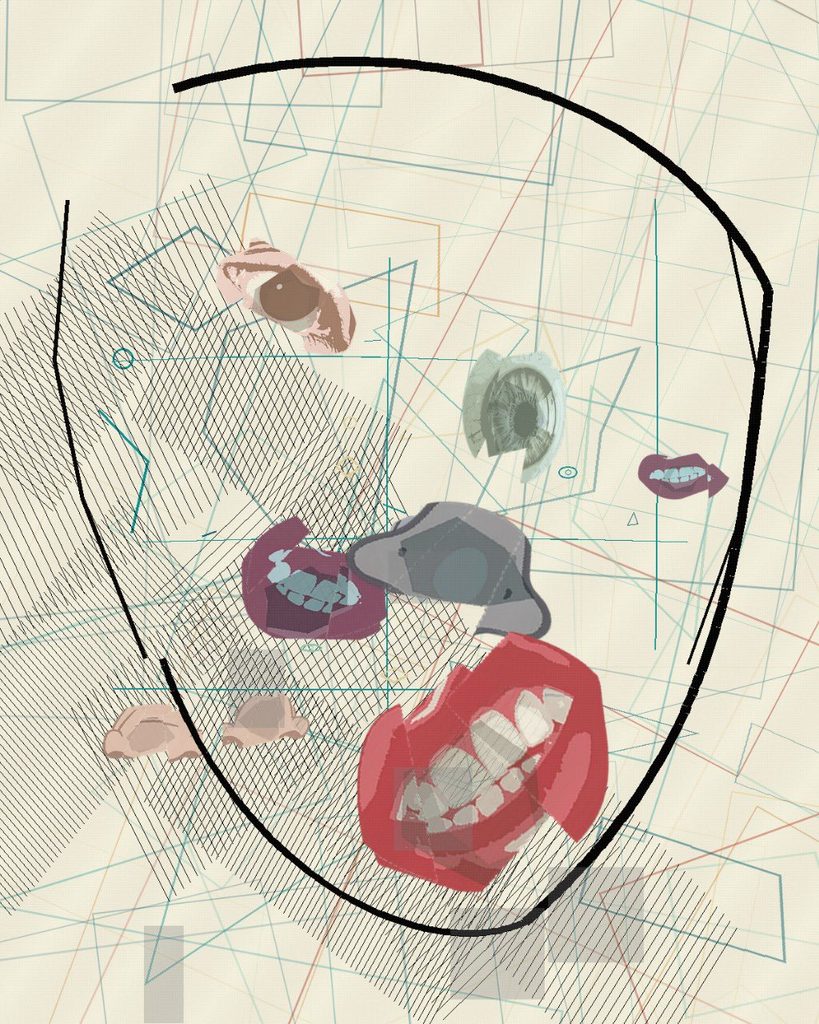
The word dichotomy means a division into two opposite parts. The first series was built on that split: blue for depression, warm colours for mania, two sides of one face in conflict. Looking back, that framing was clear but incomplete.
Bipolar disorder is not always a clean switch between two poles. Clinicians describe mixed features, when the energy and restlessness of mania arrive together with the low mood of depression. Many people describe these periods as among the hardest to live through, because there is no single state to name or wait out.
Mixed States is my attempt to draw that overlap. Instead of placing the two moods side by side, it gives each one its own behaviour and then lets them occupy the same space.
Dichotomy looked at the person from the outside. Its subject was a face, and the disorder showed up as distortion: features moved, split and placed by rules. In Mixed States there is no face. The drawing tries to show the state itself, the inner weather that the face in Dichotomy was reacting to.
The Cubist thread continues, but it shifts from Picasso’s fractured portraits toward the flatter, grid-like planes of Analytic Cubism, where a subject dissolves into small facets of the same surface. Here the facets are the whole picture.
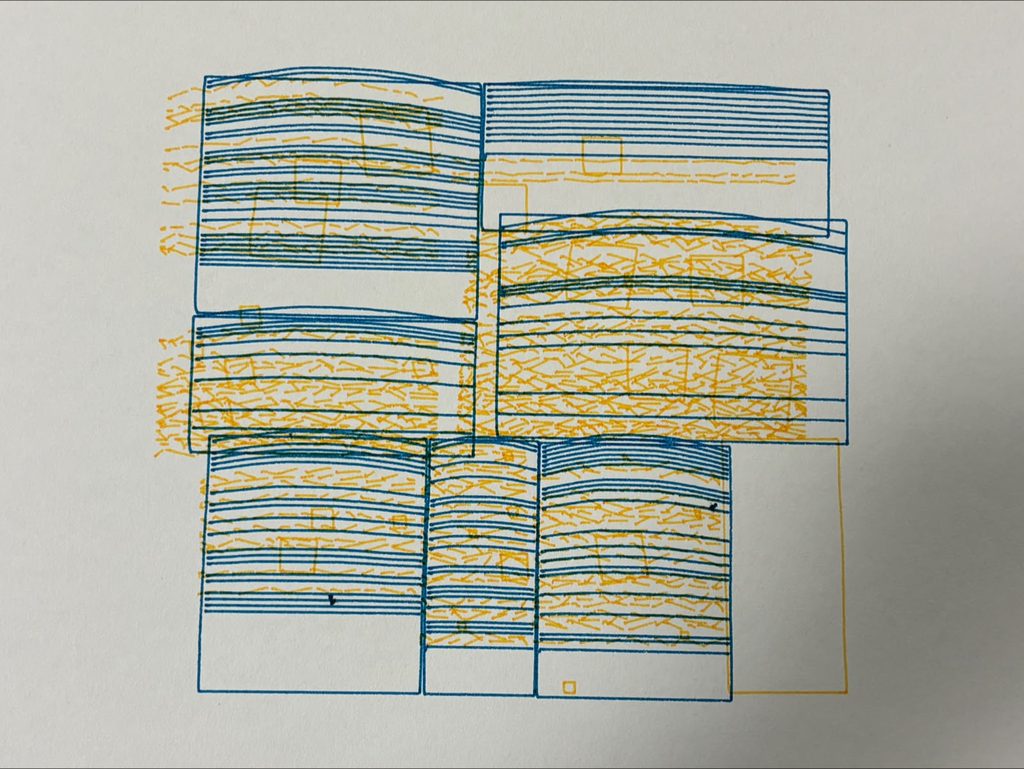
In this sheet the two moods share the whole page. Blue hatching fills every block, and orange dashes crack through the lines. Small tilted squares crowd the heavy blocks. On the left edge the orange marks spill past the blue outlines onto bare paper. Nothing on this sheet stays still.
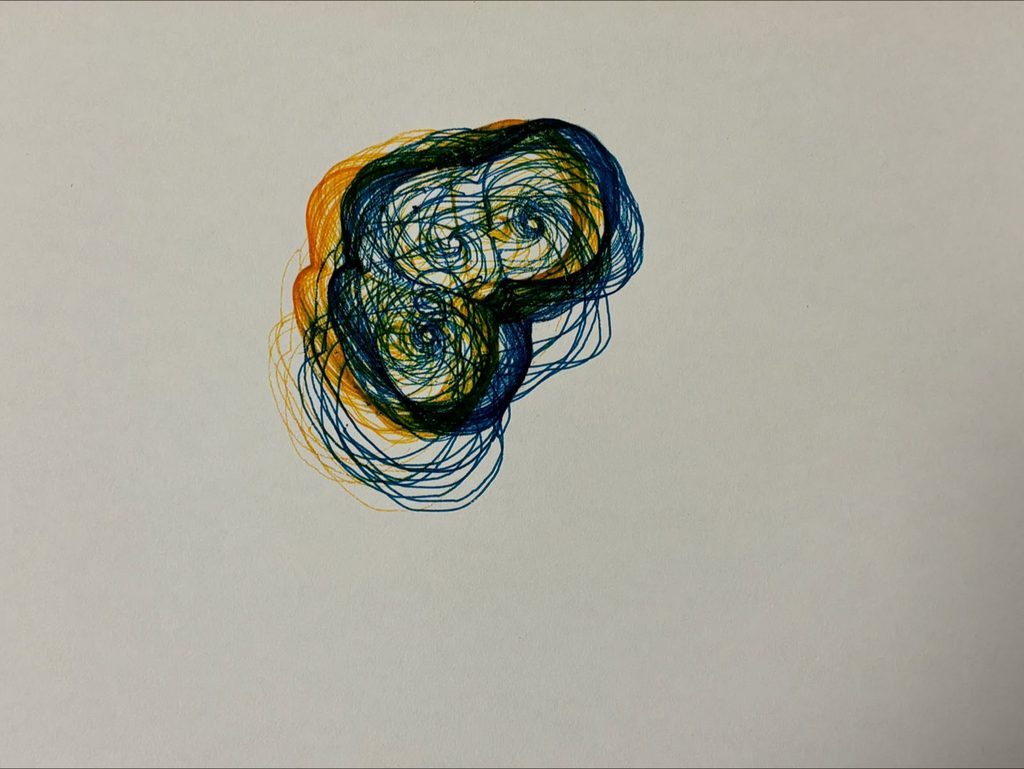
This drawing comes from the earlier line system that I will show below. The blue lines circle three centres and pile up against a wall they cannot pass. The orange lines wrap around the same knot. Where the two inks cross, the paper turns a deep green. The overlap gives a colour that neither pen carries alone.
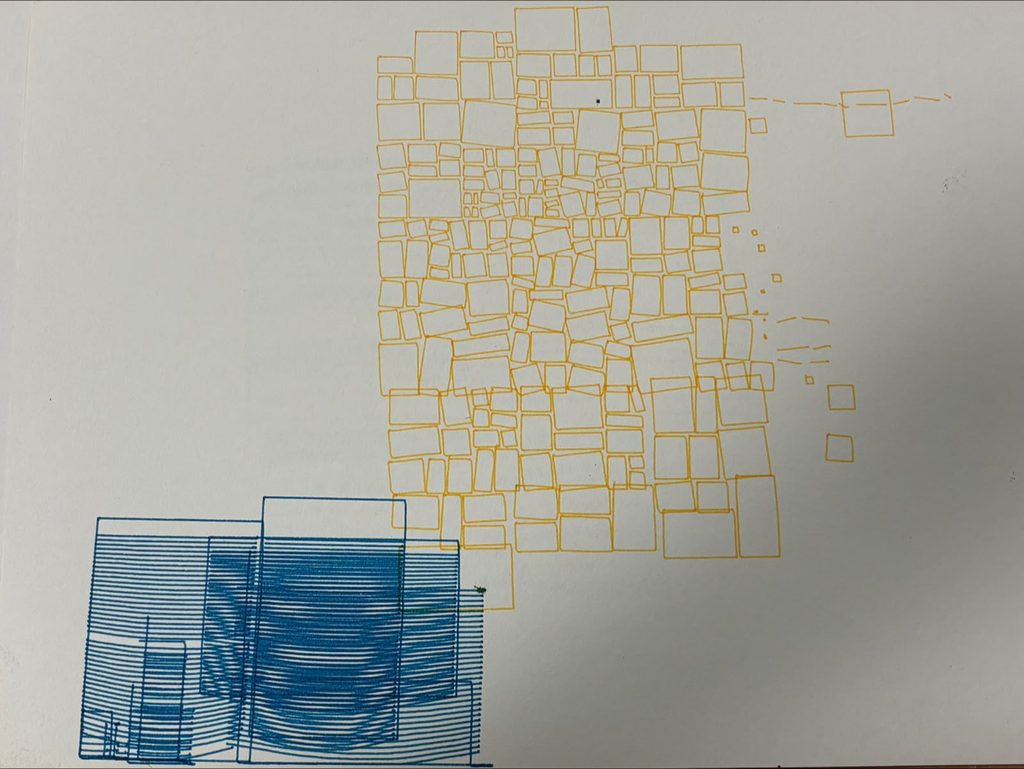
This sheet keeps the two moods apart and utilizes negative space. Orange tiles shatter into smaller pieces in the upper right, and a few loose fragments drift toward the edge. The blue blocks sink into the lower left corner and run off the paper. Their hatching stacks into a dark, heavy mass. Most of the sheet stays blank, and the empty paper holds the quiet of the depressive state.
The color and texture of the paper is very intentional, I wanted to convey the complexity of a brain mood state through a grainy texture and an atypical off-white color for the paper.
The papers are also uncut to convey the manic state of starting something you’re really drawn to and stopping mid-way as you fade from the manic state to the depressive state, hence a step against perfecting the drawing by not adding last touches like cutting the papers and getting rid of the points where the pen drops at the beginning of the sketch.
From the feedback: This piece gives a feeling of discomfort, which is conceptually what I wanted to convey. Discomfort comes from something you don’t fully understand and you’re not fully familiar with, this encapsulates my concept as every mixed state is exactly the confusion a person with bipolar feels. A person with bipolar also can not certainly recognize whether they’re having a depressive or a manic episode, and this introspective clarity is very important to deal with this disorder.
The algorithm’s implementation:
I first started with the skeleton, setting a seed and making the cell function function cell(x, y, w, h, depth) {
rect(x + 1, y + 1, w - 2, h - 2);
}
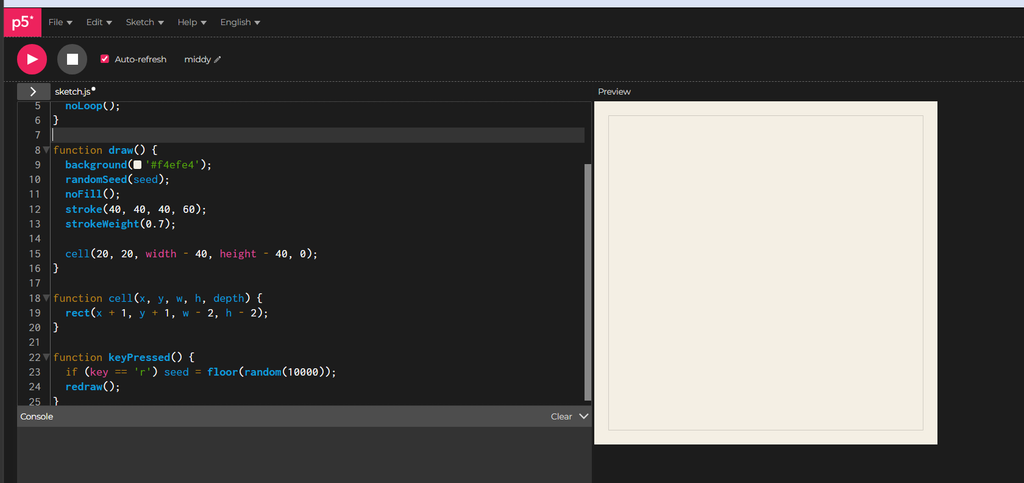
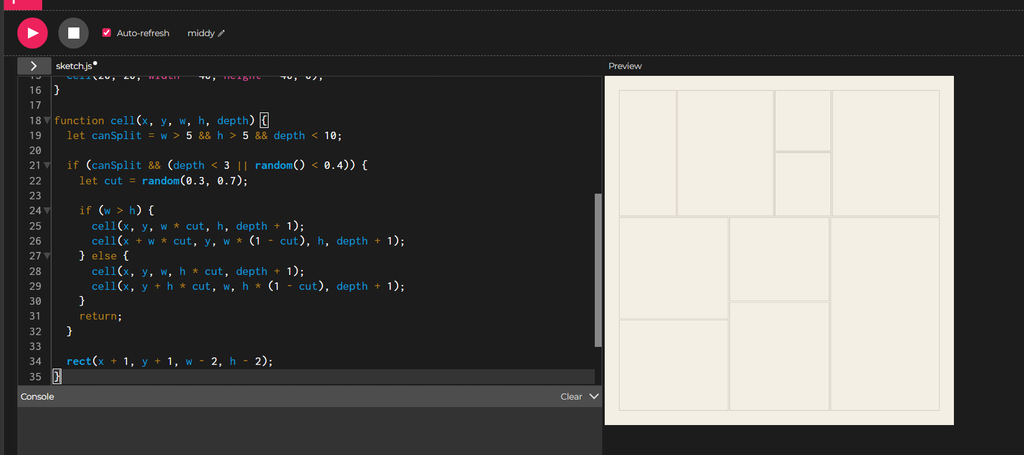
I then implement something called recursive subdivision,I think of the canvas as a sheet of paper that I keep cutting in two. Each piece can get cut again, and the code does this by letting a cell hand its area to two smaller cells.
I set a floor on the size. A piece that gets too small stops splitting. I also cap how many rounds of cutting can happen. These two rules give the process an end.
Early on, I force the cutting. The first few (3) rounds always cut, which gives me a handful of pieces to start with and keeps the page from staying one big box. After that, each piece flips a weighted coin and splits about four times in ten. Some areas keep breaking into smaller pieces while others stay whole. That difference gives the image its uneven texture.
I imagine two invisible sources of emotion on the canvas. One is mania and the other is depression. Each source is a single point, and the rest of the piece will react to how close each cell sits to those points.
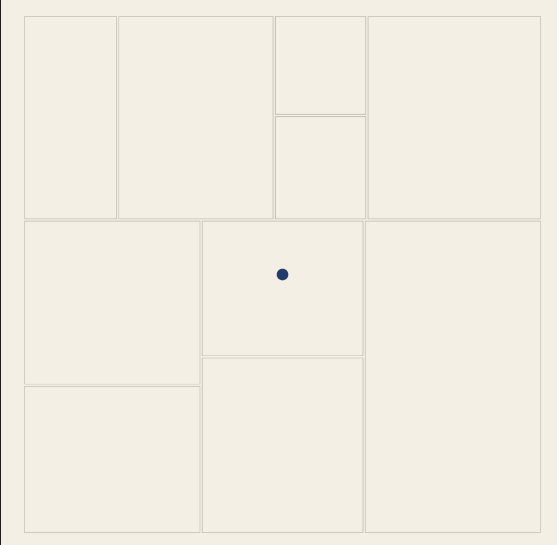
I place mania on the left and depression on the right, both halfway down the page.
The two dots are scaffolding. They make the invisible centers visible while I build, and I delete them later. The red-orange and the blue are the same colors the finished piece uses for the two emotions.
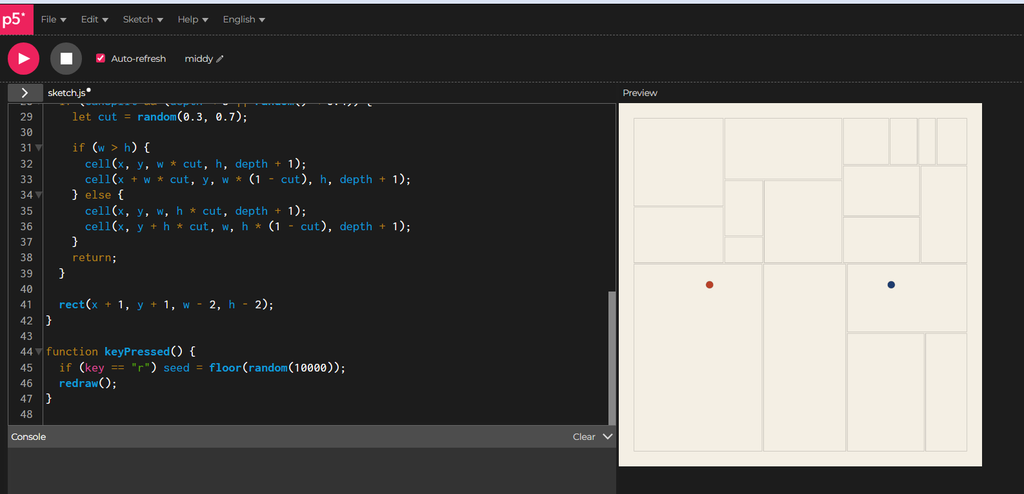
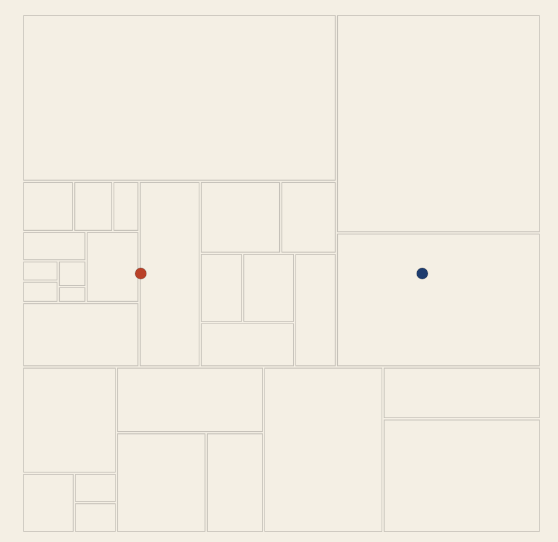
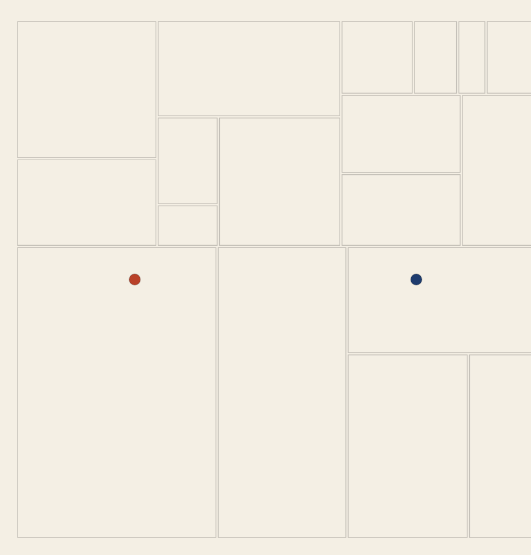
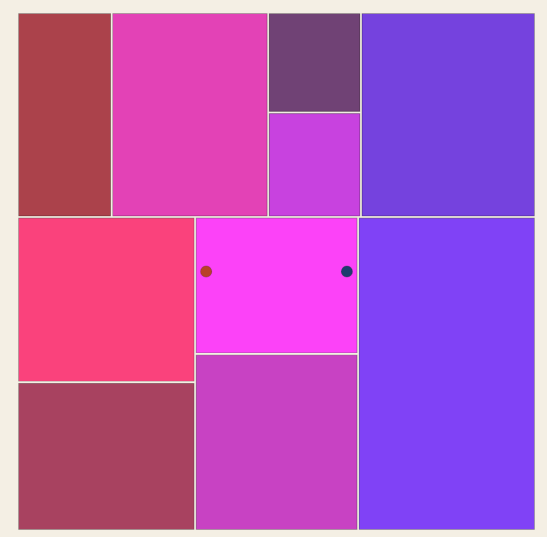
Then I add some code to control where the points are based on 1,2,3 inputs.
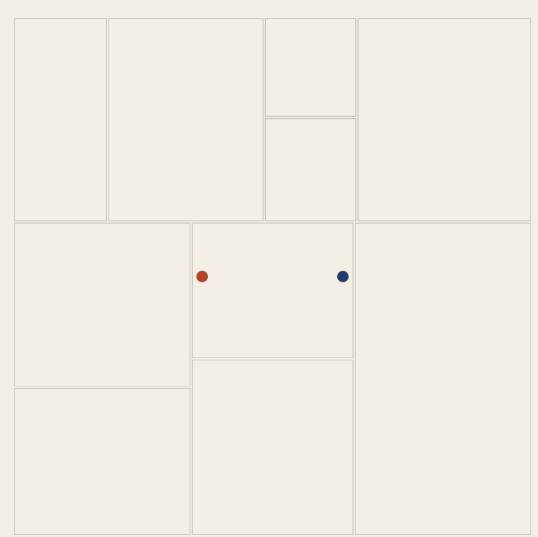
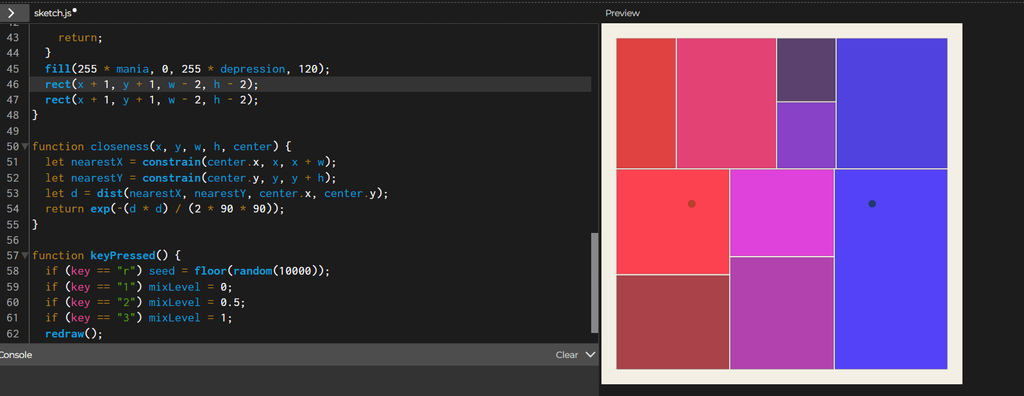
I want every cell to know how much of each emotion reaches it. The function closeness answers that with a number between 0 and 1. A cell sitting right on a center scores 1, and a cell far away scores close to 0.
function closeness(x, y, w, h, center) {
let nearestX = constrain(center.x, x, x + w);
let nearestY = constrain(center.y, y, y + h);
let d = dist(nearestX, nearestY, center.x, center.y);
return exp(-(d * d) / (2 * 90 * 90));
}
(AI disclosure: this I didn’t know how to write this function so AI helped me here, thanks Claude!)
The first two lines find the point inside the cell that sits nearest to the center. A cell that contains the center gets that very point back, and a cell elsewhere gets the closest spot on its edge. Measuring from the nearest point treats big cells fairly. A big cell that touches the center feels the full emotion, even when the middle of that cell lies far from it.
The last line turns the distance into a score. Zero distance gives 1, and the score falls away smoothly as the distance grows, along a bell curve. The 90 sets how wide the bell is. A larger number spreads each emotion across more of the canvas, and a smaller number squeezes it into a tight area around the center.
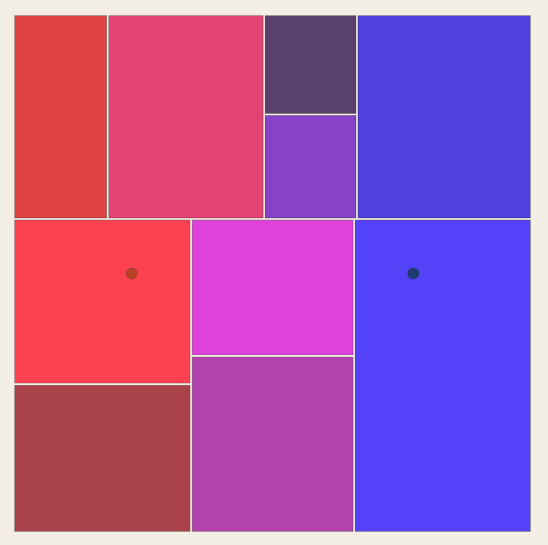
The fill is temporary. Red grows with mania and blue grows with depression. I delete this fill when the real styling arrives.
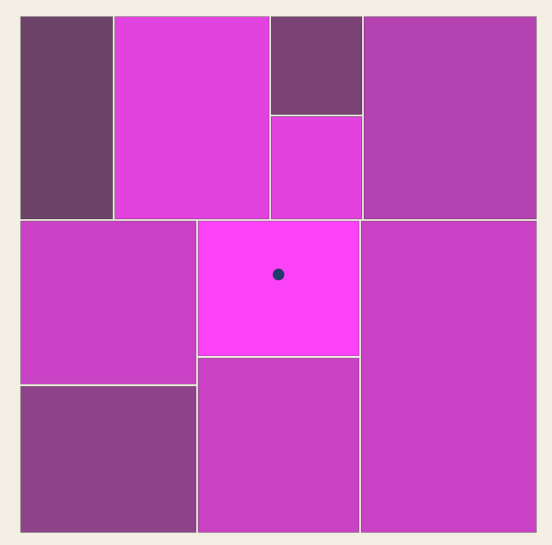
Then I make the split based on this:
let maniaWins = mania > depression;
let splitChance = 0.4 - depression * 0.4;
if (maniaWins) splitChance = 0.4 + mania * 0.6;
if (canSplit && (depth < 3 || random() < splitChance)) {
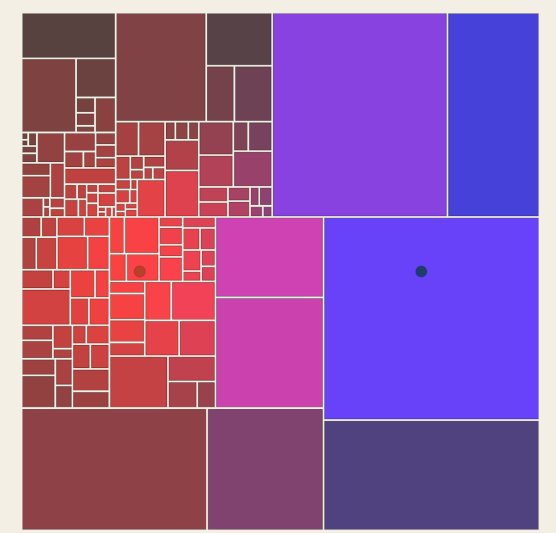
Now I remove the fill and add this instead:if (depression > 0.35) {
stroke(30, 60, 110, 170);
rect(x + 1, y + 1, w - 2, h - 2);
} else if (mania > 0.2) {
stroke(185, 65, 40, 180);
rect(x + 1, y + 1, w - 2, h - 2);
} else {
stroke(40, 40, 40, 60);
rect(x + 1, y + 1, w - 2, h - 2);
}
The checks run in order, and the first one that passes decides the style. Depression comes first. A cell that feels depression above 0.35 gets a blue outline. A cell that fails that check moves on to the next one, where mania above 0.2 gives it a red-orange outline. A cell that feels neither strongly enough keeps a faint gray outline.
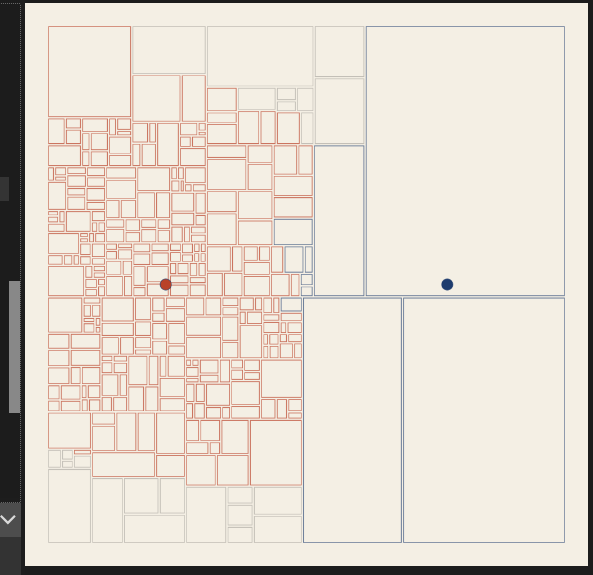
} else if (mania > 0.2) {
restless(x, y, w, h, mania);
} else {
function restless(x, y, w, h, energy) {
stroke(185, 65, 40, 180);
push();
translate(x + w / 2, y + h / 2);
rotate(random(-1, 1) * energy * 0.4);
rectMode(CENTER);
rect(0, 0, w - 2, h - 2);
pop();
}
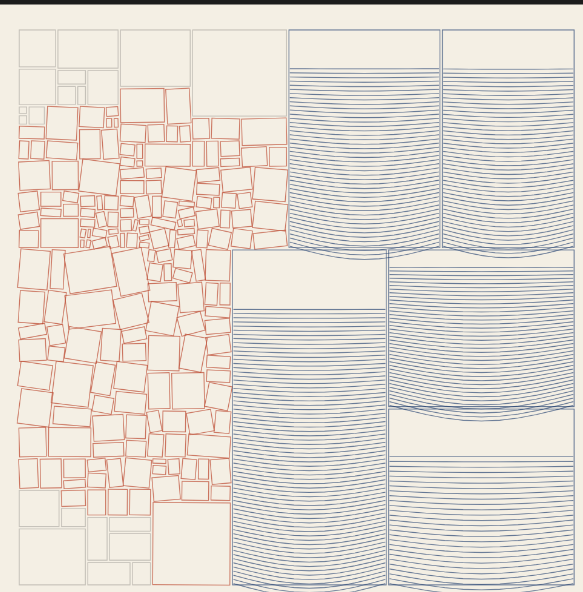
Each blue cell becomes a container that fills from the bottom, like liquid settling. The depression score decides how full it gets. A higher score gives a taller fill, tighter lines and a deeper sag.
The lines start at the bottom and climb. Each one bows downward in the middle. The function sin(t * PI) is 0 at both ends and 1 in the center, and y grows downward on the canvas, so adding it pulls the middle of the line down. The bend shrinks as the lines climb. The lowest lines carry the most weight and sag deepest, and the top lines sit almost flat.
Scrapped concepts:
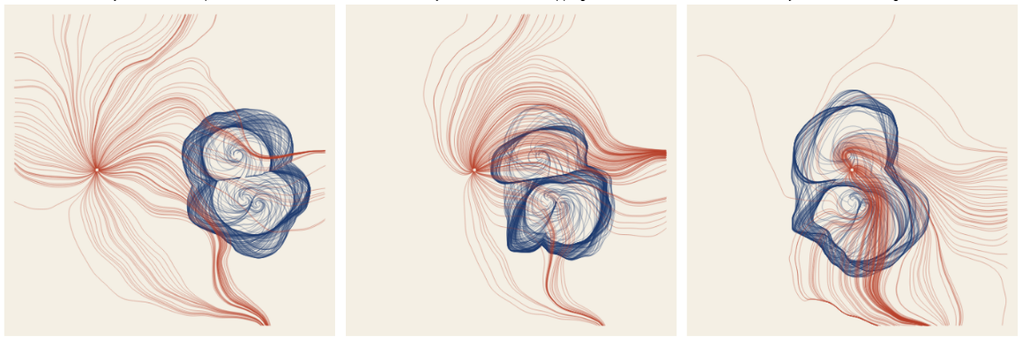
- This like failed hard when I tried to draw it.
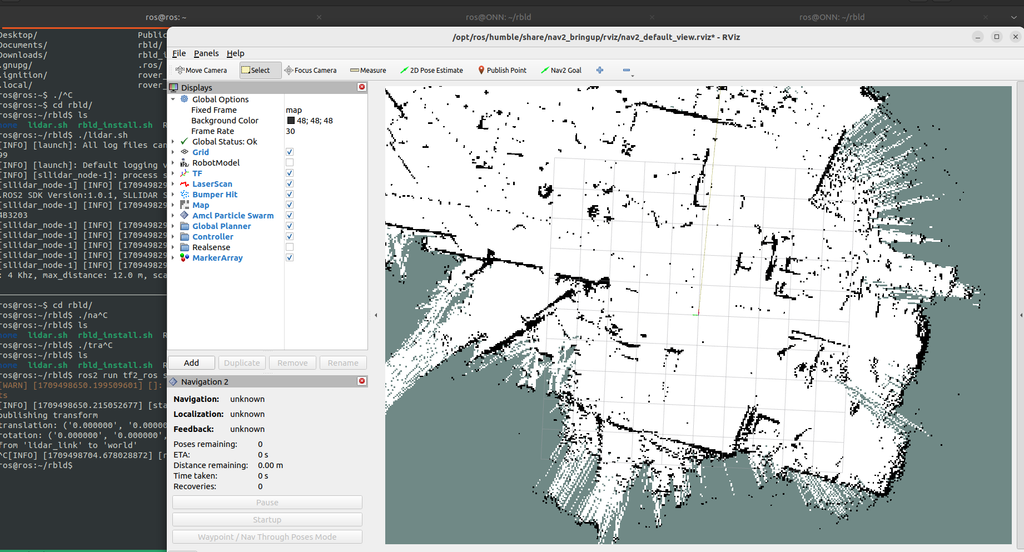
2. The first direction for this project came from a LIDAR sensor. In my robotics research, my hand once entered the sensor’s field, and the screen showed it as a loose cluster of points. The points of my hand looked the same as the points of the wall behind it. I planned to turn that moment into drawings. A robot maps a room by keeping whatever stays still and discarding whatever moves, and the people in the room become noise in that map. The drawings separated the room the robot keeps from the bodies it throws away. A second machine, the pen plotter, drew both layers with the same indifferent line. The idea built on Deborah Lupton’s argument that data represents bodies in “very limited, impoverished ways” from the book The Quantified Self.
I tried to map the lidar idea into a kaliedoscopic form which I found too cliche and has no strong conceptual background:
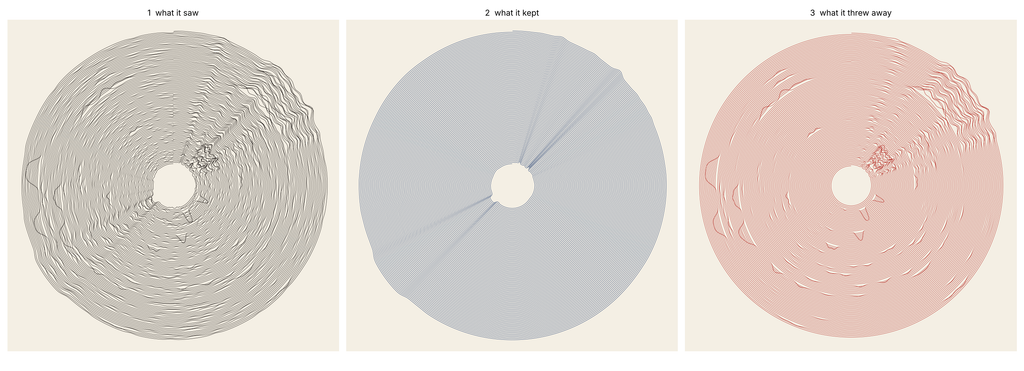
Lidar output visualized:
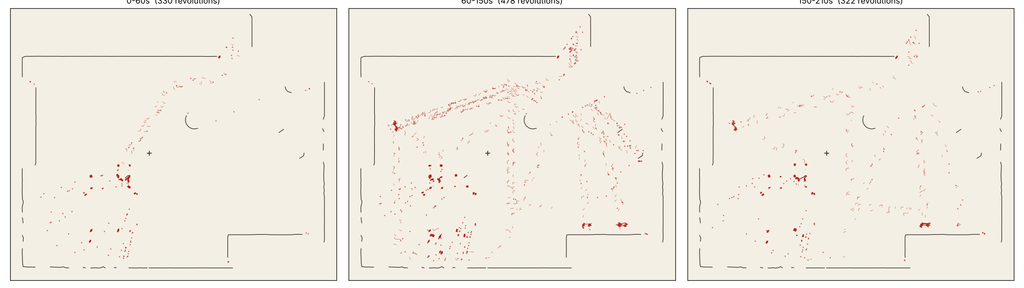
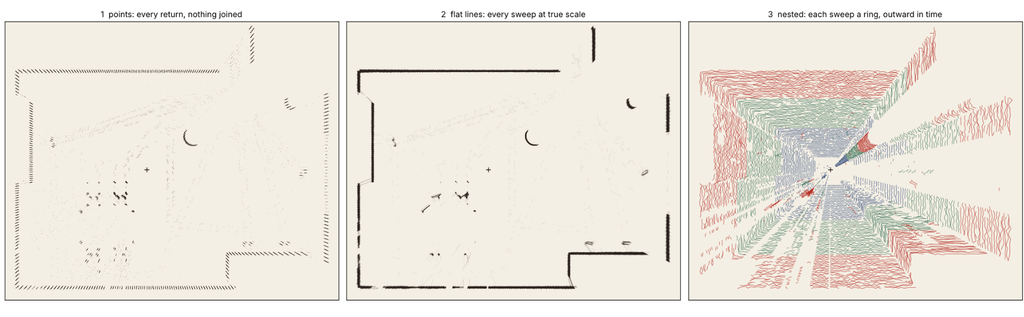
A lidar visualization in the software:
ِAnother idea was this
Also another part of why i scrapped this is the hassle, I had to create a whole ROS node to get the raw lidar data into csv.
Also parsing this bad boy is no easy task:
3) I wanted to map music into something. I just didn’t do anything for this idea just scrapped it fully.
4) I didn’t know how to build upon Dichotomy so I tried this
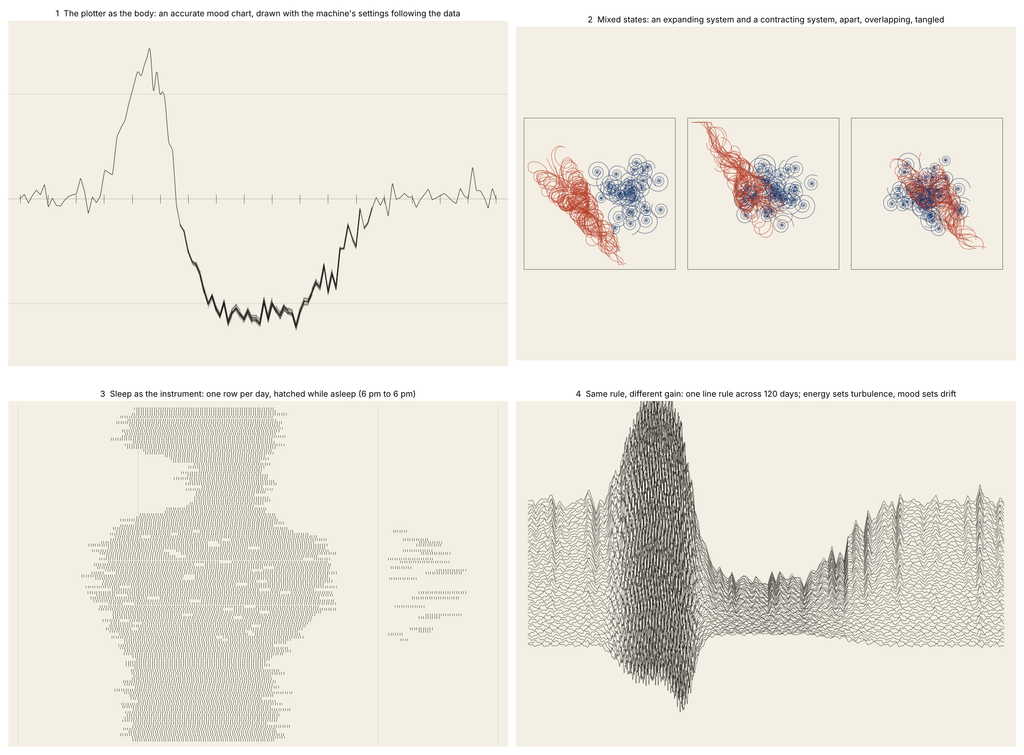
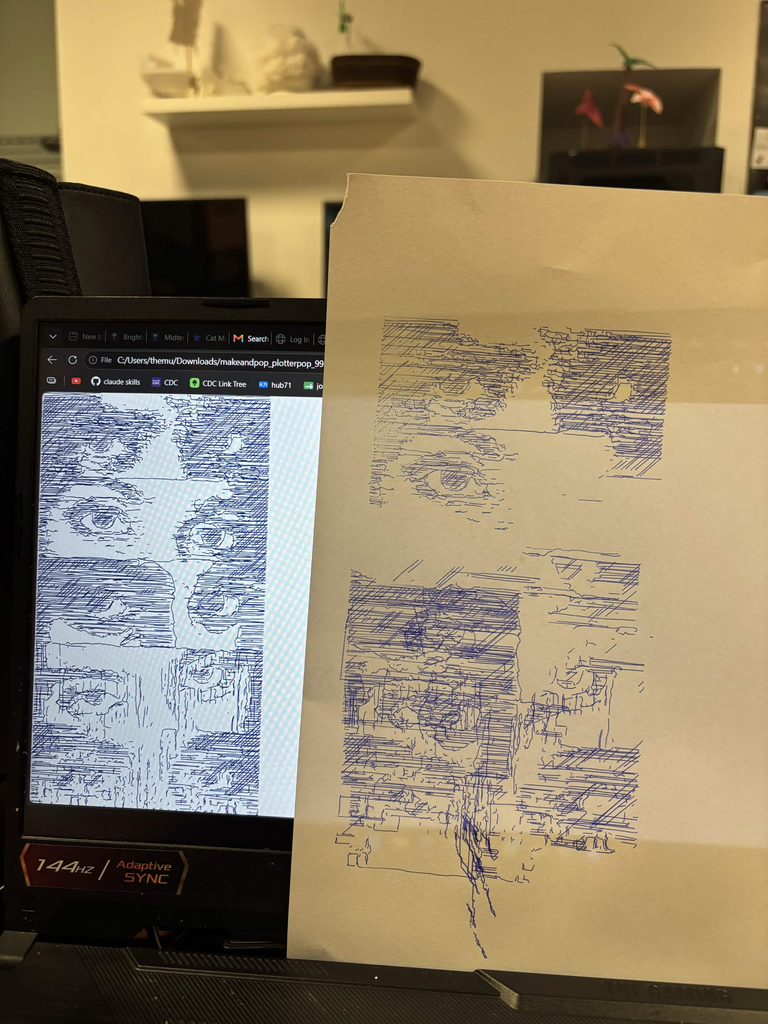
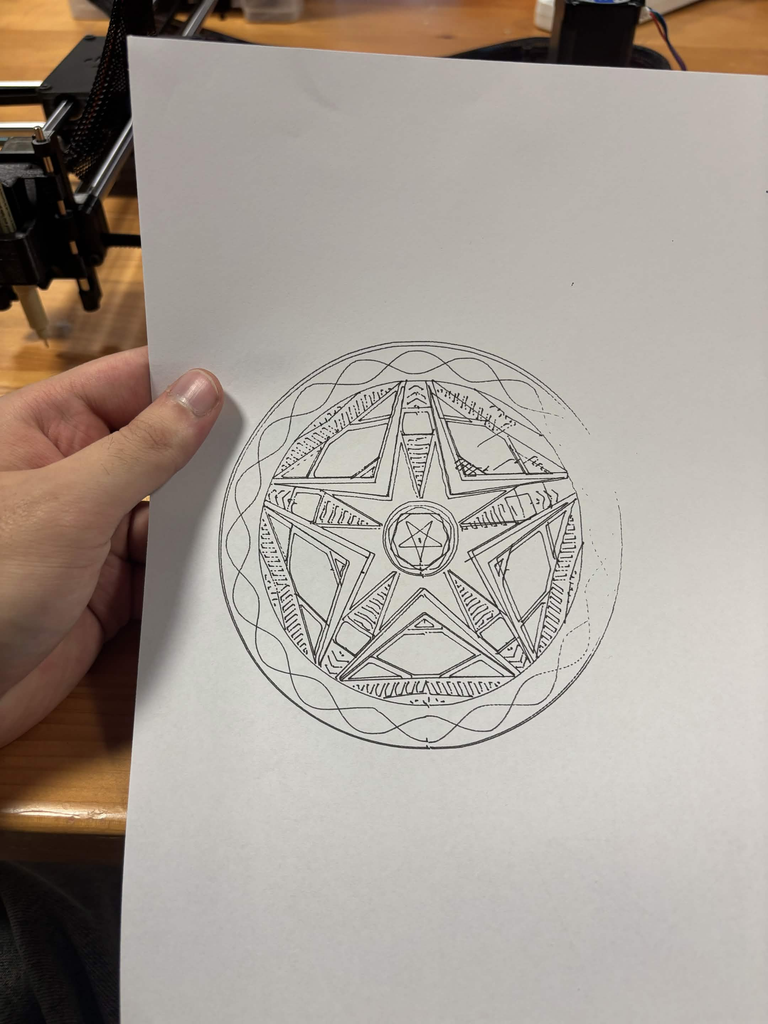
I took the idea of mixed states and turned it into Geometry. Here’s my Gcode and my SVGs
Here are also some scrapped implementations
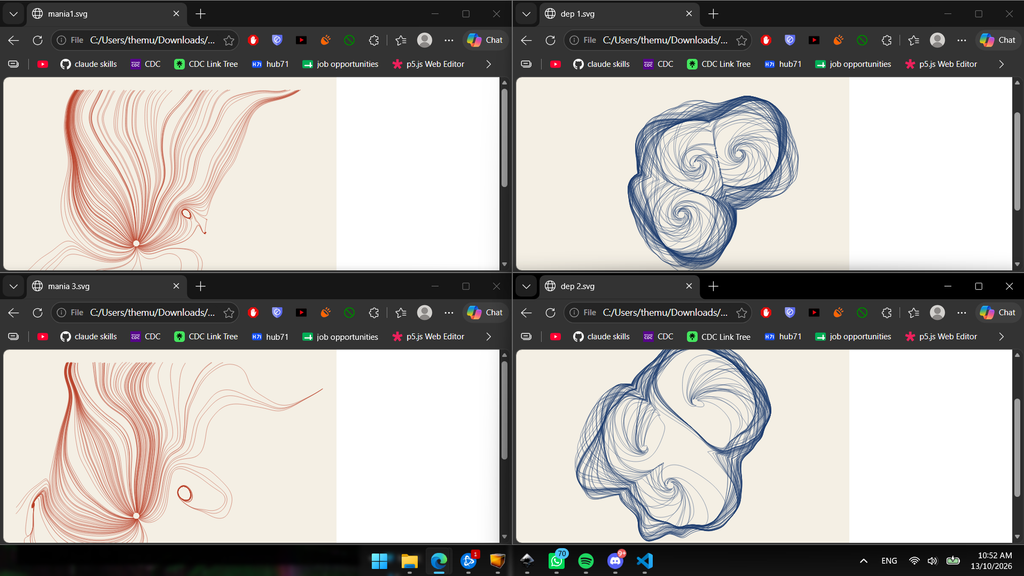
also here’s a failed attempt
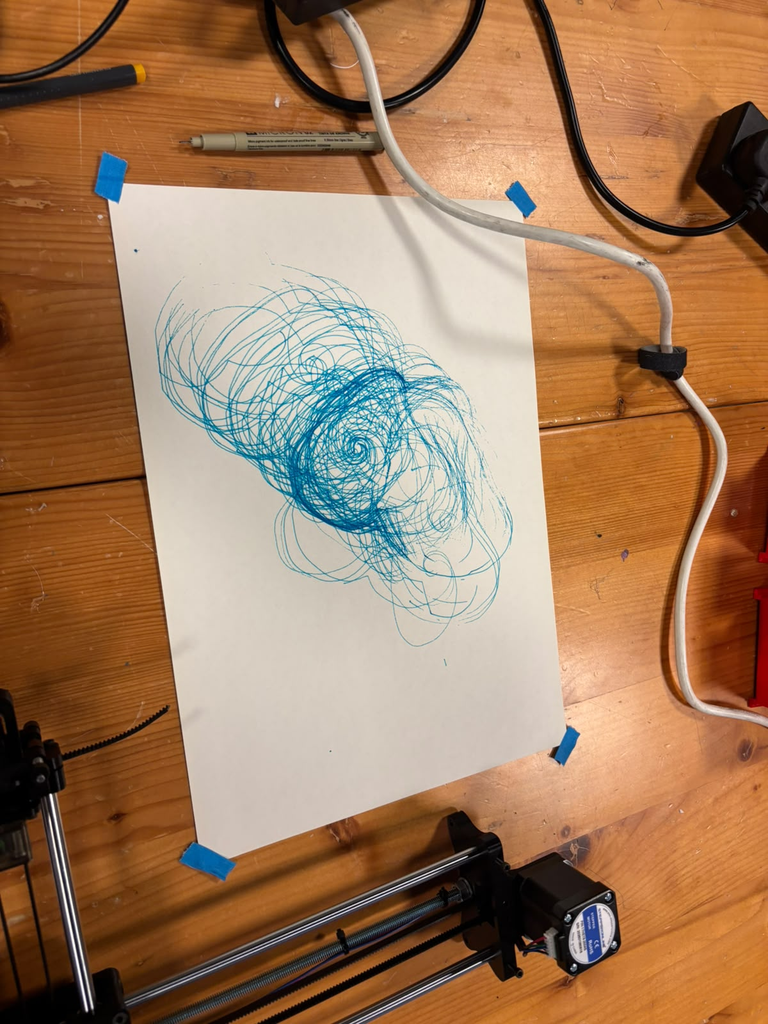
Here are some other random attempts as well for random things:
critical reflection on how the pen plotter shaped the final work.:
The plotter changed this work more than any line of code did. On screen, the lines were see-through and the blocks looked light. Every pass puts down full ink, and the blocks on paper came out way heavier than the preview. In the code, the blue hatch lines sat three to six pixels apart. On paper the ink spread into those gaps, and the lines melted into one dark mass. At first I thought I’d messed up. Now I think the heavy blocks fit depression better than my screen version ever did.
I kept the colours from Dichotomy: blue for depression, warm colours for mania. For mania I went with an orange pen. Orange feels restless on white paper, and it stays lighter than the blue. Then the flow field sheet surprised me. Where the orange and blue lines crossed, the inks mixed into a deep green. The mixed state made its own colour on the paper, and I never coded any green.
Each mood saves as its own SVG layer, and the plotter draws one layer per pen. I swapped the pens by hand in between. The second layer didn’t land in exactly the same spot as the first. On the tangled sheet, the orange dashes spill a few millimetres past the left edge of the blue blocks. In the code every dash stays inside its block, and the shift came from the machine and the paper. I left it in. The restless marks escape the heavy blocks, and honestly the image is better for it.
Layering shaped the empty parts too. The grey cells in the neutral zone only showed up on screen. The export skipped them, and on paper that whole area went blank. On the apart sheet, blank paper takes up most of the page. I didn’t plan that space. Now it holds the quiet of depression.
The paper and pens left their own traces. You can see small ink blots where the pen paused at the start of a line. On the apart sheet the drawing sat low on the page, and the blue blocks run off the bottom edge. The weight sinks right out of the frame.
The plotter also showed me where the system falls short. The hatching ate up most of the plotting time. On the tangled sheet the orange covers a lot of the blue, and the heavy blocks lose their shape. Next time I want wider hatch spacing and fewer cracks on the tangled sheet. The screen preview hid all of this. The first plot on paper showed it right away.