I’m either really spontaneous or really uptight. Sometimes I’m happy to see where something goes, and sometimes I need every single thing to go to plan. For this midterm, I wanted to explore those two sides through fluidity and rigidity, and also just experiment with what the pen plotter could do.
What would happen if the pen followed one continuous line? And what if the drawing was made entirely of separate straight lines? I liked that the same machine could make things that felt so different.
Fluidity
For my inspiration, I came across a reference where one continuous line spirals outwards and becomes increasingly affected by a noise field. I really liked how much could happen within that one line. It made me want to try something similar and see if I could make it feel like a flowing flower, with uneven petals and folds.
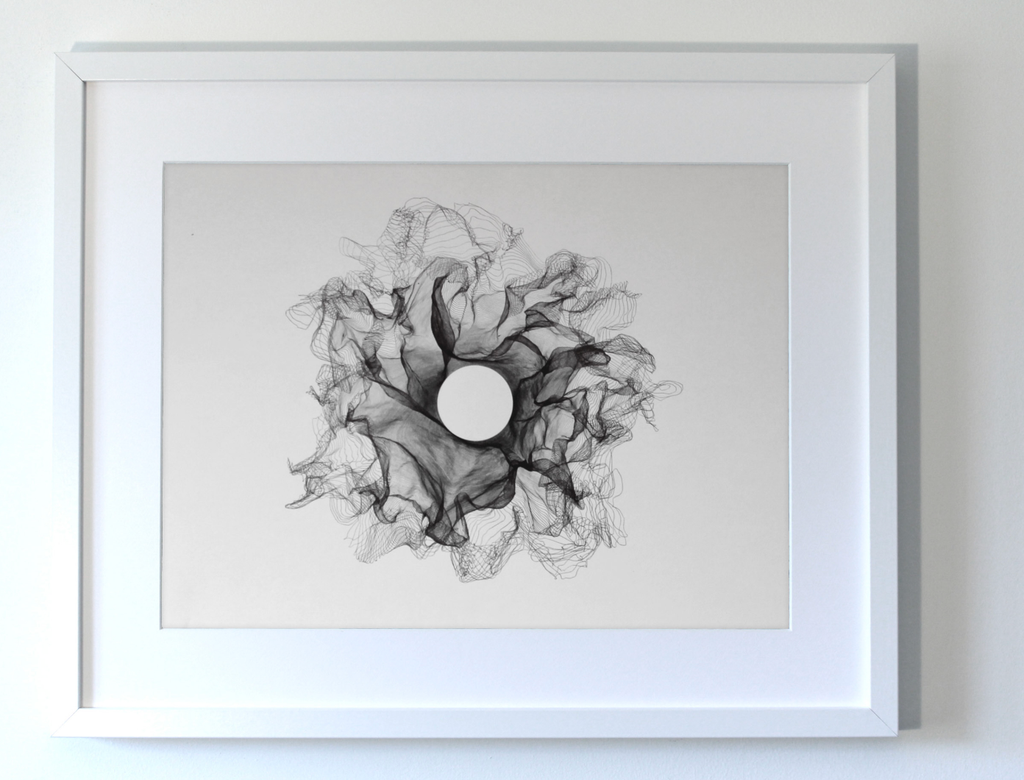
My flower starts as a spiral in p5.js. As the line goes around the centre, its radius gradually increases. Sine waves make it move in and out to create petals, and noise makes those petals uneven. The centre shifts slightly too, so the whole thing doesn’t stay perfectly symmetrical.
I experimented with the number of petals, the rotation, the twist and how much noise affected the shape. Every variation came from the same system, but some felt much more interesting than others. I could keep changing things and seeing what happened without having to redraw the whole thing myself.
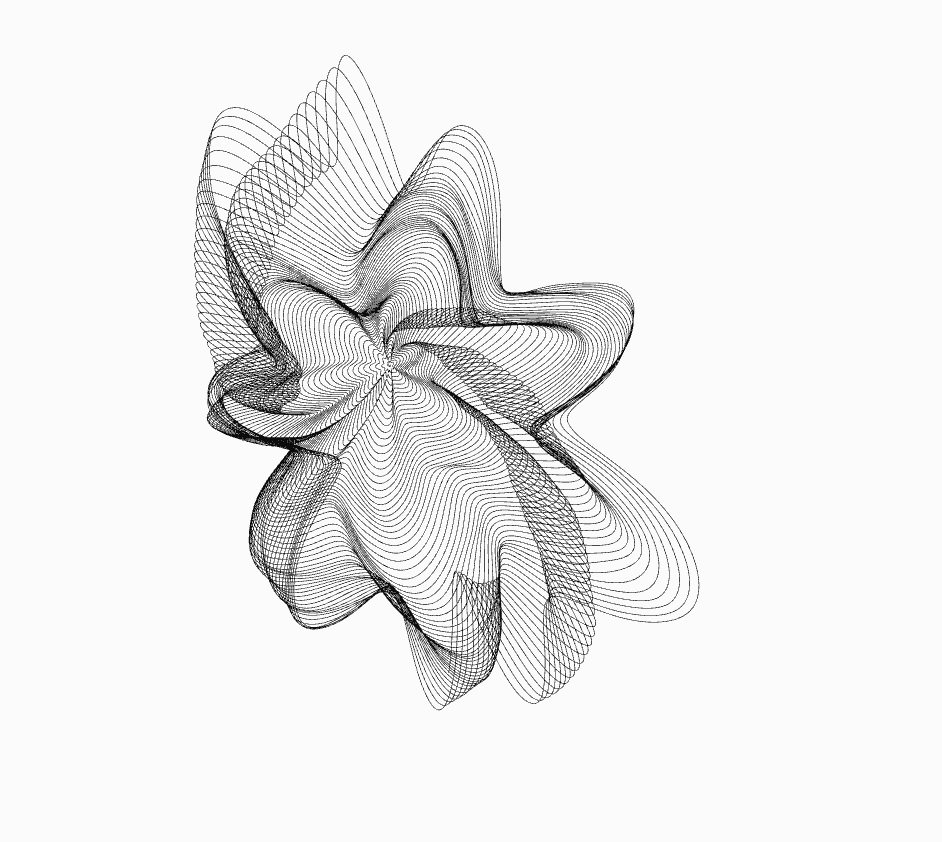
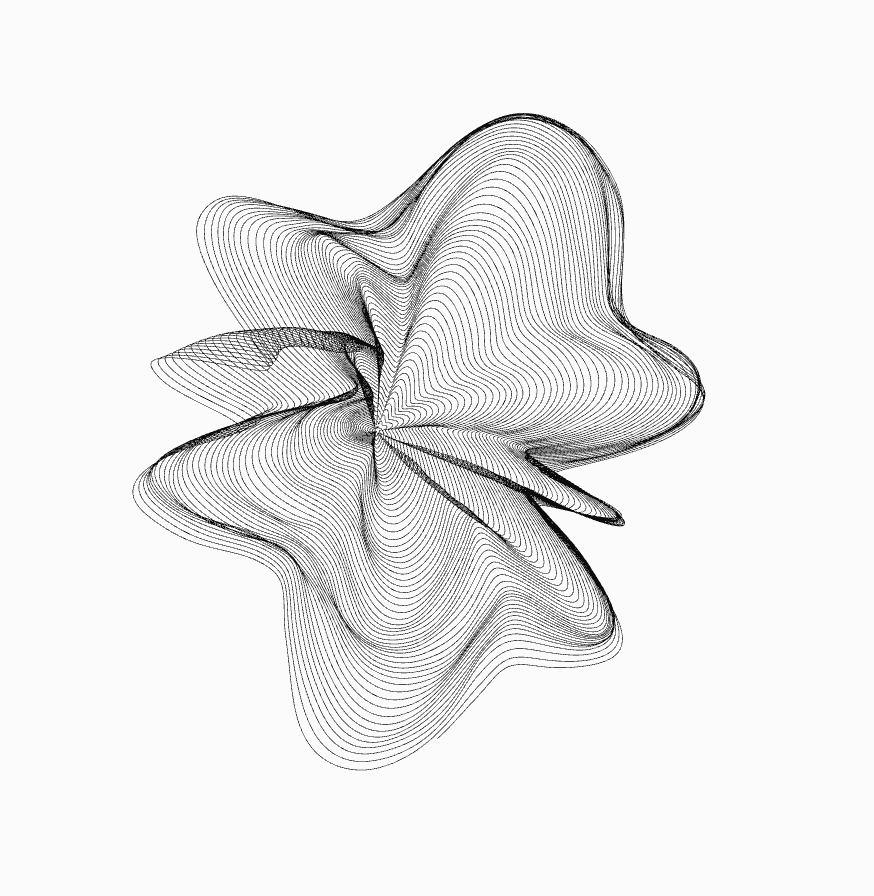
I liked having that much room to experiment. Although I was still choosing which variations to keep, so I wasn’t exactly letting go of control completely hahahah.
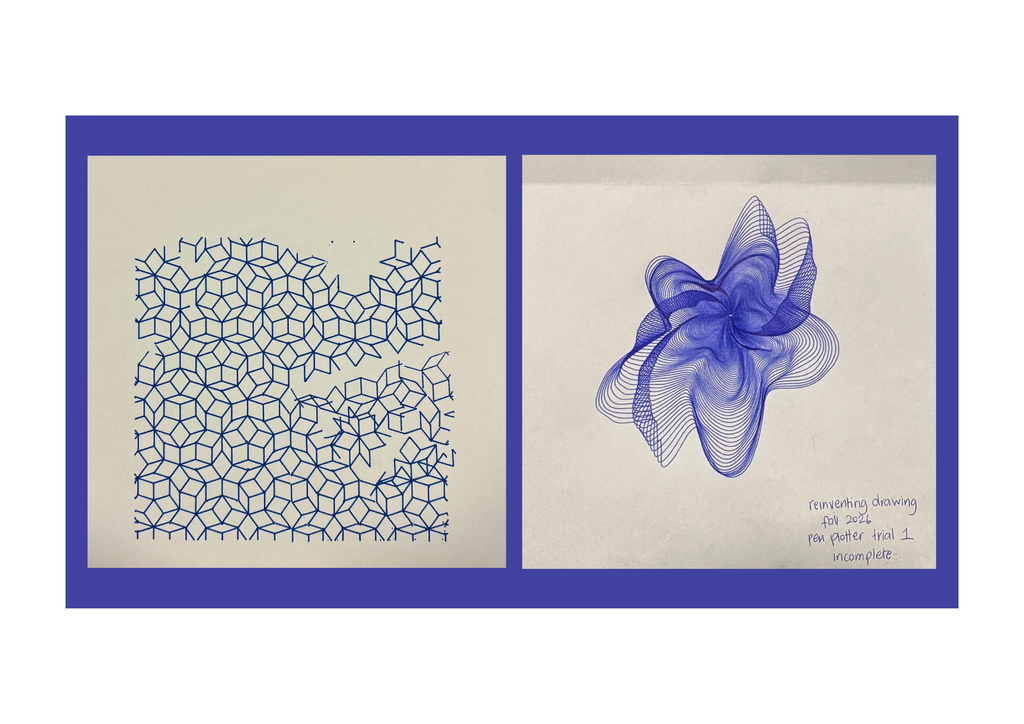
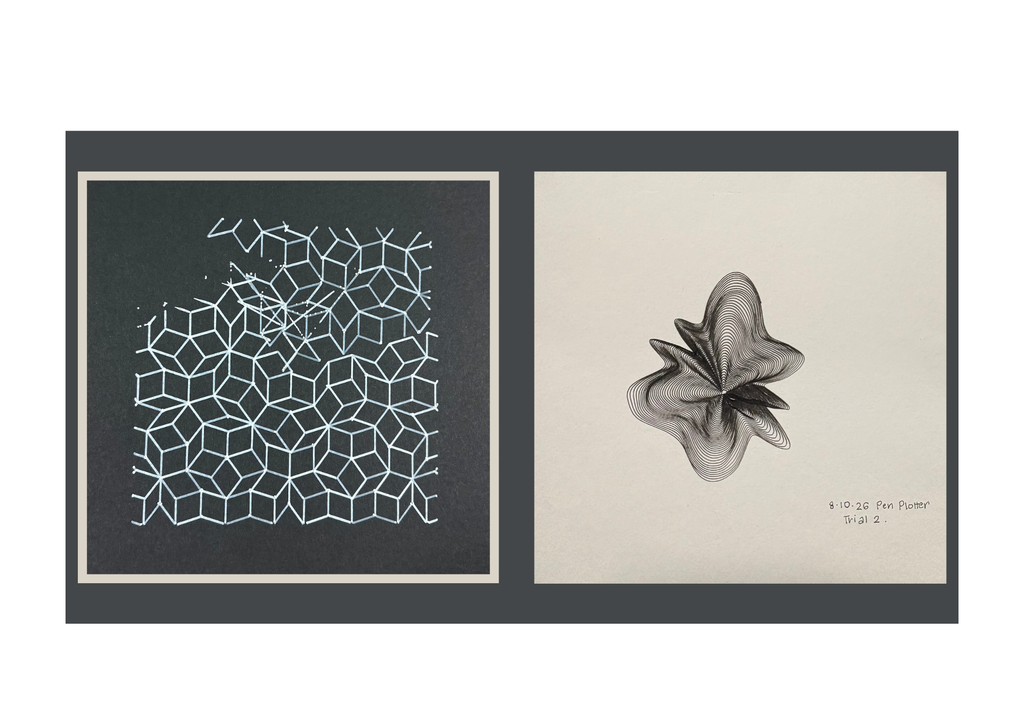
My flower trials were in blue and black. The blue one was incomplete, but it still helped me see how the lines would build up. I ended up keeping it as part of the collection.
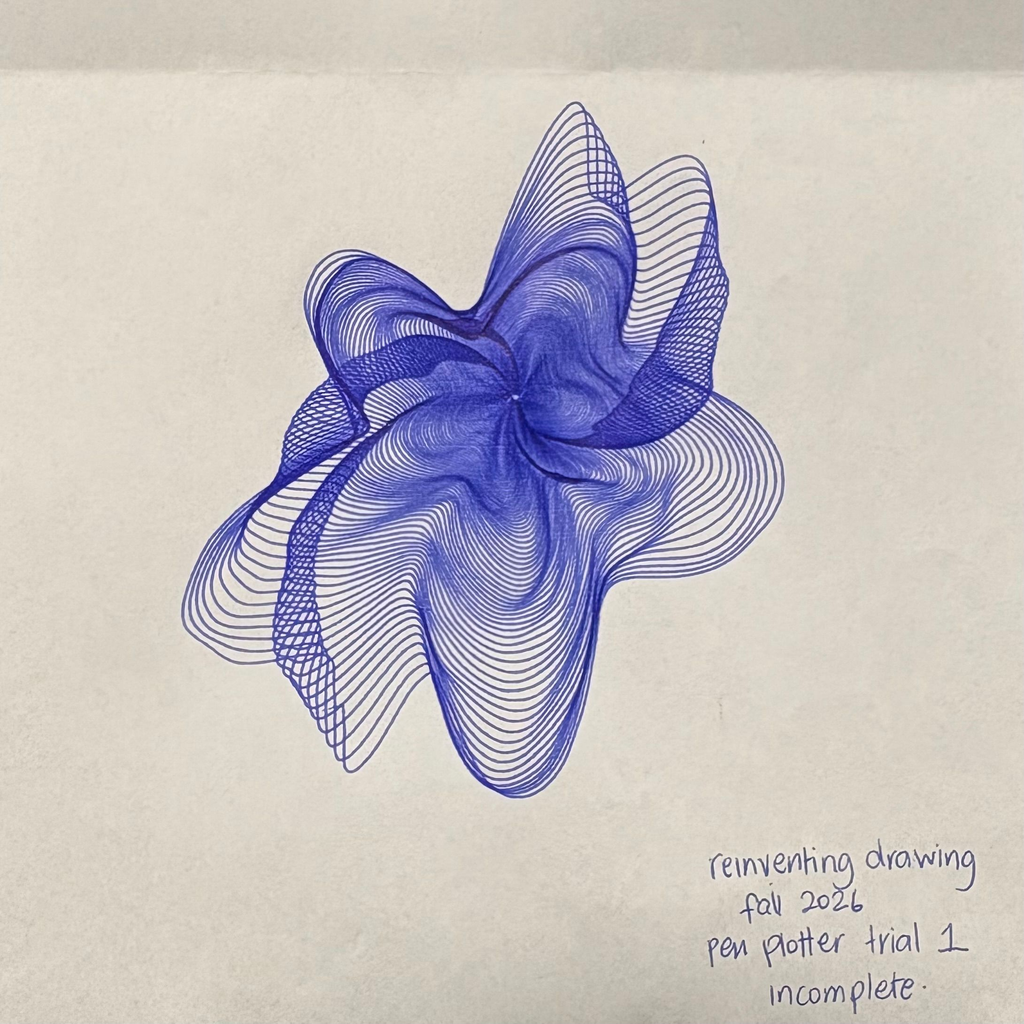
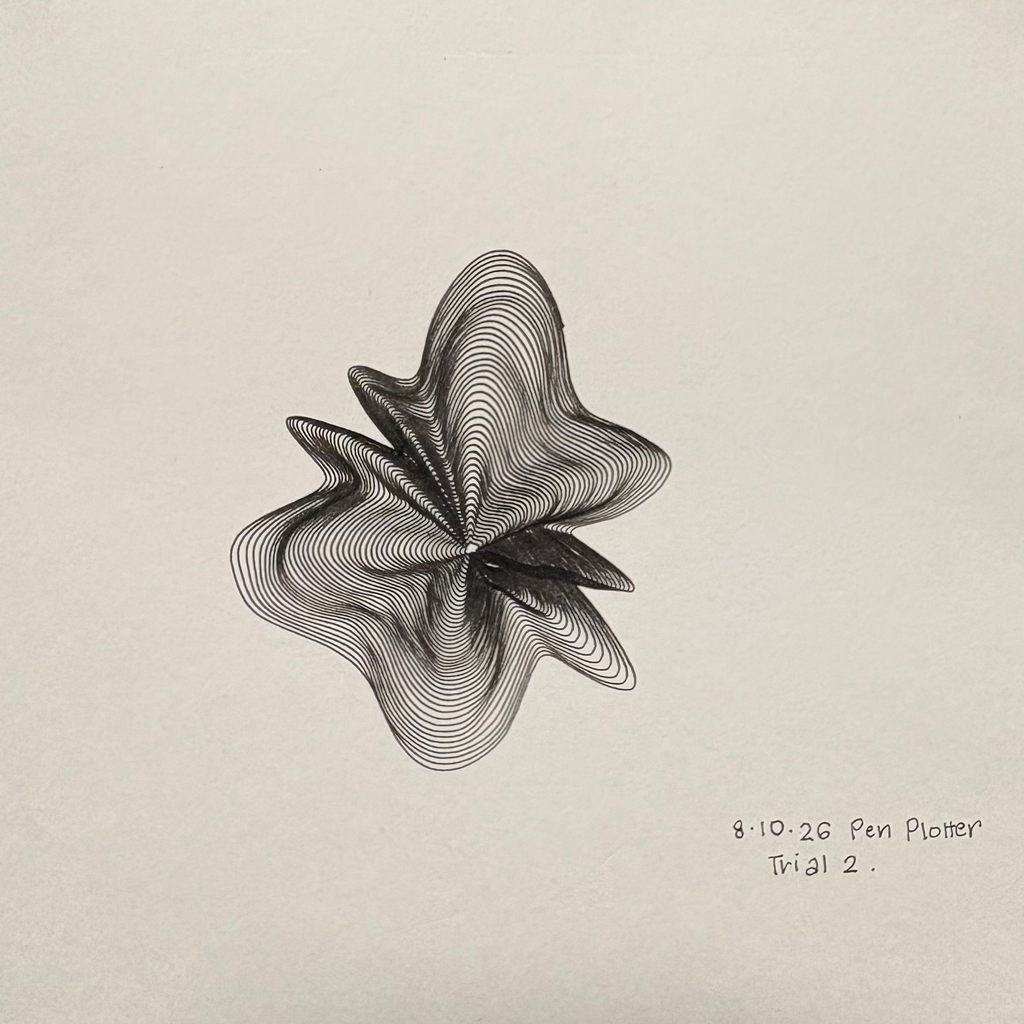
The blue flower feels more open and stretched out to me. The black one feels tighter, with darker folds around the centre. I liked seeing how different they could look while still coming from the same approach.
It also made me realise that the pen matters more than I initially thought. A thin line on screen doesn’t necessarily stay delicate on paper. Once the lines get close together, the thickness of the ink changes how much space is left between them. Would a finer pen make the folds clearer? Or would I lose some of the darkness that makes them look 3D?
Rigidity
For rigidity, I explored Penrose tiling. I’ve been interested in geometric patterns since the laser-cutting assignment, and I wanted to return to that through a different tool.
A Penrose tiling is aperiodic, meaning that smaller shapes and arrangements recur, but the whole pattern doesn’t repeat at regular intervals like a grid. I liked that it looked so organised, but wasn’t as predictable as I first thought.
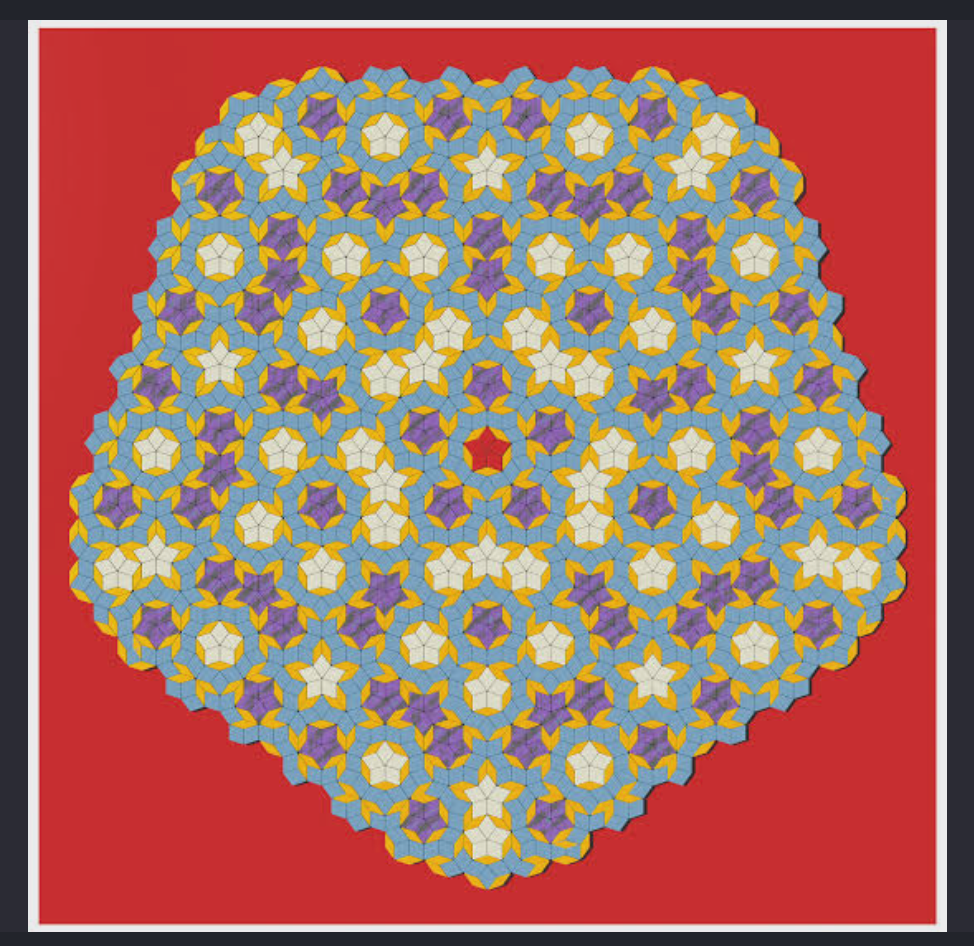
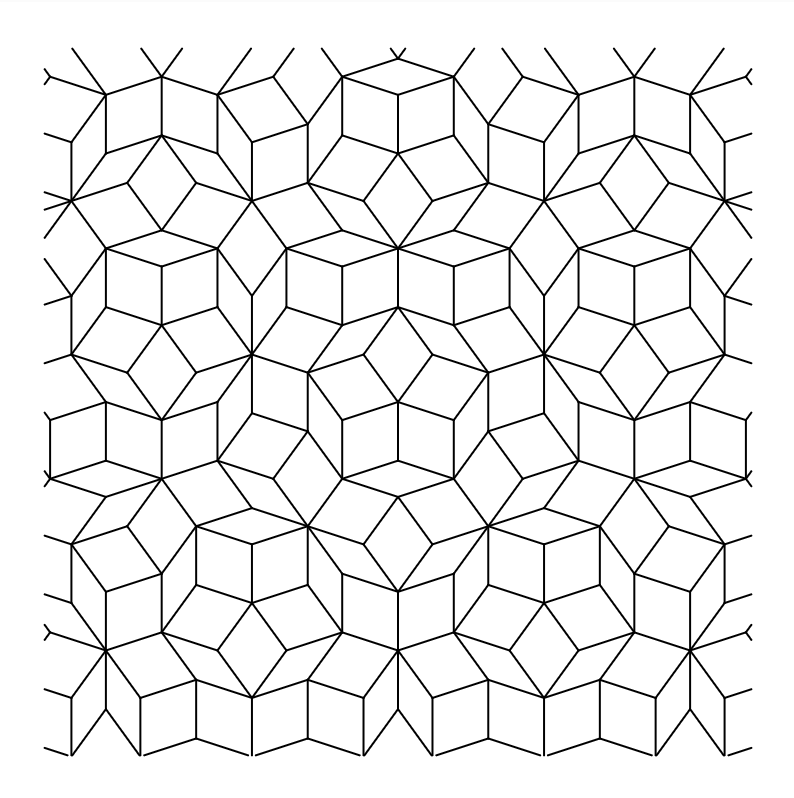
I followed the triangle-subdivision method in Jeff Preshing’s Penrose Tiling Explained, with the help of AI to implement it in p5.js. Basically, it starts with ten triangles around a centre and repeatedly divides them into smaller triangles using the golden ratio. Drawing only two sides of each triangle allows neighbouring triangles to form diamond-shaped tiles.
My sketch also removes duplicate edges so the same shared line isn’t drawn twice, crops the pattern into a square and exports it as an SVG.
Watching this plot felt quite different from the flower. The flower keeps going around itself, while the Penrose keeps stopping, lifting the pen and moving somewhere else. I could see the difference in how the machine was drawing, which was a really interesting observation.
Fails(?)
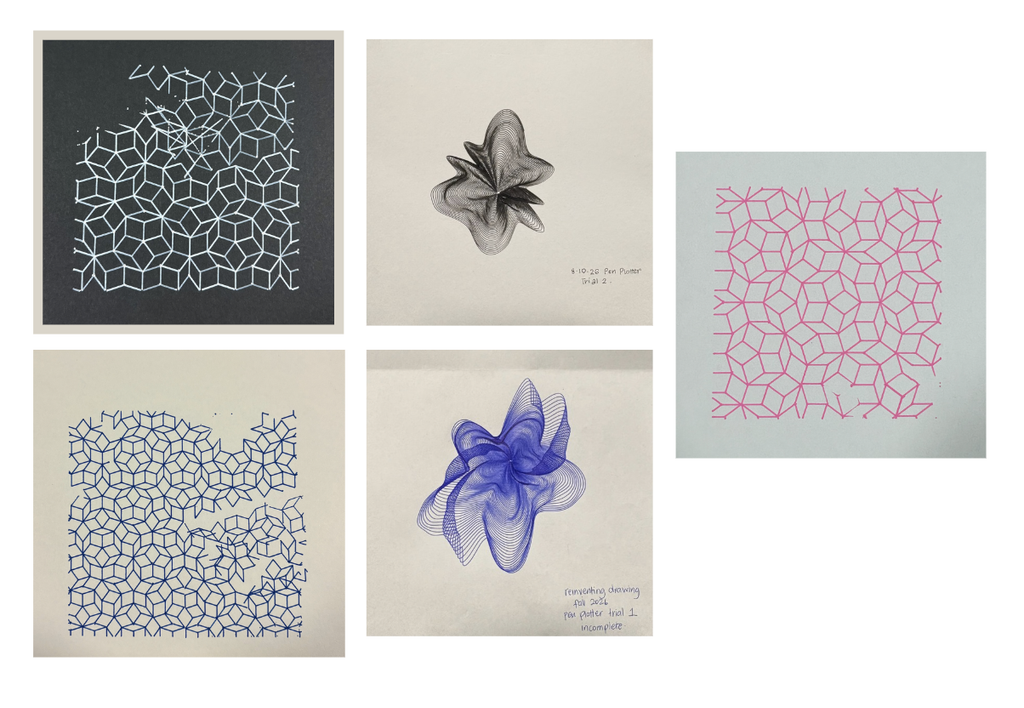
The Penrose drawings have missing sections, gaps and extra lines that weren’t in the digital design. Which is a little funny considering this was supposed to represent the part of me that wants everything under control.
I found the gaps frustrating, but they also made me look at the drawing differently and surprisingly I ended up liking it more than if it was finished perfectly.
From code to the plotter
My workflow was p5.js → SVG → G-code → pen plotter.
I generated the designs in p5.js and exported them as SVGs. For the flower, the points are connected into one continuous polyline. For the Penrose, the file contains individual edges.
The SVG paths for the penrose design were then converted into G-code in inkscape. Getting the drawing to look right on screen was only one part of it. I still needed the physical tests to see whether it would actually draw the way I expected.
My p5.js sketches:
Final collection
Reflections
I started with the idea that the flowers would be fluid and the Penrose would be rigid. But the flowers need precise rules to look that loose, and the Penrose follows a strict system without regularly repeating or following a system.
I genuinely think every unexpected mark improved the final work. Some of the gaps interrupted things I wanted to keep, and I’d still like to understand what caused them but overall I’m in love with how the drawings turned out.
I wanted to experiment with control, and then found myself getting frustrated when I couldn’t control the result. Which feels fairly accurate to where I started from.
But I also like that the final collection tells a story. The incomplete blue flower, the broken geometry, the areas where the ink made random dots. Those became part of how I understood the drawings, the pen-plotter and in turn, myself.
I remember that day in the lab when your pen plotter kept bugging out and creating errors but I actually think it looks really nice with those imperfections. They fit so well they actually look intentional.
I was actually inspired by the iteration you did with the black paper and a bright marker and also chose one of my iterations to also use black paper with the metallic marker (not sure if that’s the same one you used). It’s on my dorm room wall right now and think it looks really nicely.